
Publish Survey Reports
To access this screen:
-
Activate the Survey Reports ribbon and select Reports >> Publish Report.
This task is used to publish results from previously run end-of-month survey reports. Reports are selected for publishing according to the survey date assigned during reporting. You can select one, some, or all reports for publishing.
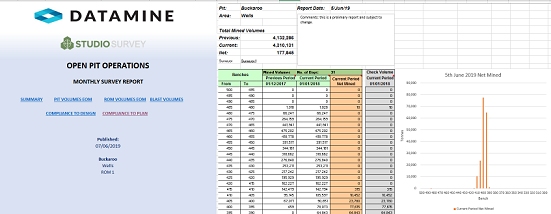
An example of a survey report
This facility is currently available only for open pit survey scenarios.
Note: This tool supports batch processing: use Add to Batch to schedule processing at a later date, using the Run Batch task.
Data and reports are generated in various formats by the EOM reporting tools.
Where possible, results are displayed per bench according to the bench definition for the current reporting scope.
A summary spreadsheet containing results for all EOM reports for the selected date or dates is published in Microsoft Excel format (`.xlsx`) and requires Microsoft Excel on the host system. If Microsoft Excel is available, it launches automatically with the spreadsheet.
Multiple summary reports can be generated. Each output summary report is named according to reporting scope, that is, the pit, area, and ROM to which it refers. Each report is generated in a date-specific folder.
The spreadsheet is formatted according to the specified Excel template, which is customizable:
This spreadsheet is generated in the Studio Survey database by using the current spreadsheet template, and is displayed on completion.
If you use the installed standard template, each report type is stored on a separate worksheet with summary and raw data worksheets. Some worksheets are hidden by default.
Note: Your Studio Survey Excel template is stored in your Studio Survey database. If you create a new template and folder, you may need to link your database to it by using the Survey Database Settings panel.
Report Worksheets
Studio Survey, by default, issues a workbook containing the following worksheets. You can customize these by editing the Excel template or introducing your own VBA macros:
- A Cover page containing a company logo, a title, and a publishing date.
- An EOM Summary worksheet containing summary results for currently published reports.
- A Pit Volumes EOM report containing mined volume summary data and per-bench results. Data is generated by the Pit Actual reporting tool. More...
- A Stockpile Volumes report containing per-stockpile LCM volume results and summary results for all stockpiles. Data is generated by the ROM reporting tool. More...
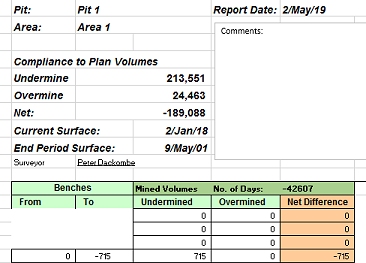
- A Compliance to Design report showing undermined and overmined results, total and per bench, for the reporting period. Data is generated by the Design Compliance reporting tool. More...
- A Compliance to Plan report showing undermined and overmined results, total and per bench, for the reporting period. Data is generated by the Plan Compliance reporting tool. More...
- A Blast Volumes report showing blast volumes generated for the reporting period. Data is generated by the Generate Blast Volume reporting tool. More...
Previewing and Loading Report Data
EOM reporting panels offer functions to preview both your report input surfaces/strings and your output volumes and reports/tables.

- Preview data: available for all report inputs represented by 3D data.
- Load data: available for all report inputs represented by 3D data, including output data.
If results data is previewed, up to three separate displays will be created:
- A PDF or .emf report: this is generated based on the current Plot Template that is associated with your project. Only displayed if it is possible to generate an output report in this format. Not seeing a PDF or .emf report? Check to see if your report has an associated plot template, using the Database Settings screen.
- Wireframe Volume: this represents the cut & fill solids created by your reporting task. This is shown in Datamine's Table Previewer application. Only displayed if it is possible to construct a 3-dimensional volume from the input data of your report.
- A Report Table: this table, in Datamine format, contains the volume assessment of your cut & fill volumes for the selected report. If it is not possible to construct a 3-dimensional volume, a table (nor any other output) will be displayed.
Publish a Report
Activity steps:
- Confirm reporting scope by checking Current Pit, Current Area, and Current ROM.
- If required, update scope by using the browse controls to open Database Settings.
- Set the Report date to associate with the current survey report. The default value is the current date.
- Select the report outputs to publish:
- EOM Pit to create or update actual pit volumes from Pit Actual.
- EOM ROM to create or update stockpile volumes from ROM.
- Compliance to Design to compare designed versus surveyed pit walls from Design Compliance.
- Compliance to Plan to compare actual end-of-period surfaces against planned and scheduled surfaces from Plan Compliance.
- If you need blast volume publishing, select Blast and set the start and end blast dates from the available survey dates generated by Generate Blast Volume. To publish a single blast, select the same date in both lists.
- Click Publish to generate the summary Excel spreadsheet for the selected reporting dates.
Note: The EOM Pit, EOM ROM, Compliance to Design, and Compliance to Plan tasks can all generate data as part of a batch process. The Publish Report task can also be batch processed. For example, you can batch process those four cut-and-fill tools and then run an automated publishing step. Publishing dates cannot be specified until reports are run. To automate publishing, a <latest> option is available so publishing can process the most recent data, including data generated during the same batch run. <latest> is available as a date-selection option for all reports that support batch processing.
Add to Batch: add the current report definition to a queue of batched tasks that can be run later using the Run Batch task. Data will not be processed until the batch is processed, meaning changes made to data between report specification and execution will be included.
Related topics and activities